
Hubie Brown and Using Shot Charts To Improve Shooting Percentages
As a big follower of Hubie Brown, I take a lot of what he says as gospel. When he says it, it is most often very true. At one of his clinics, Hubie convinced me of the necessity of keeping shot charts during scrimmages and games.
Why?
The first thing he said that stuck with me every time I see a shot chart is that, in a clinic, Hubie divided the court into 3 sections. He announced that “no matter how good a shooter you have, they will only shoot a high percentage from two of the three areas!”.
Every time I have seen a shot chart, I have seen that statement borne out. At the NBA level, every strong shooter has one of those 3 areas as a cold point. LeBron James, Kevin Durant, James Harden, it doesn’t matter. Each of them has one of the 3 areas that Hubie outlined as a cold area.
If pro’s can shoot well from 2 out of the 3 areas, then chances are pretty good my younger players may have only one spot they are relatively effective from.
As a coach, you should be using shot charts to self-diagnose your offense. Do you know where your players' strongest shooting areas are?
Is your offense getting players' shots in their strongest areas?
Shot charts are the most accurate way of gaining this information. How good is your floor balance? How well are you swinging the ball from one side of the floor to the other? Are you attacking the entire floor, or just one side of the defense?
Shot charts can give you your answer more emphatically than just observational data.
An Effective Teaching Tool
Your players may respond well to it too. A basketball player has the marvelous ability to create a myth about themselves in their own head. Sometimes they will shoot again and again from a spot, without success.
“Why do you keep shooting that shot? That’s not your shot!”
“But coach, I am normally good from there!”
At this point, wouldn’t it help to be able to go to the shot chart?
Defense
Hubie’s rule applies to everyone, not just your team. In addition to scouting your own offense for effectiveness, a shot chart can be used to find an opposing player's sweet spots, and allow you to work extra hard on defense to deny catches in areas where the opponent demonstrates ability.
Who is their strongest player? Where does he do his best work? The shot chart allows you to find where their best players' shots come from, and where you need to work to deny him the ball.
Who Keeps the Chart?
Sometimes, student managers are hard to come by. But every coach should have a bench, and every coach should want to keep their bench “in the game”. Every player should be focused on what is happening on the court. Keeping the shot chart is a great way to keep players on the bench involved in the game. When their number comes up, the board should be handed to another player who continues to keep the chart until their number is called.
How Do You Fill the Shot Chart Out?
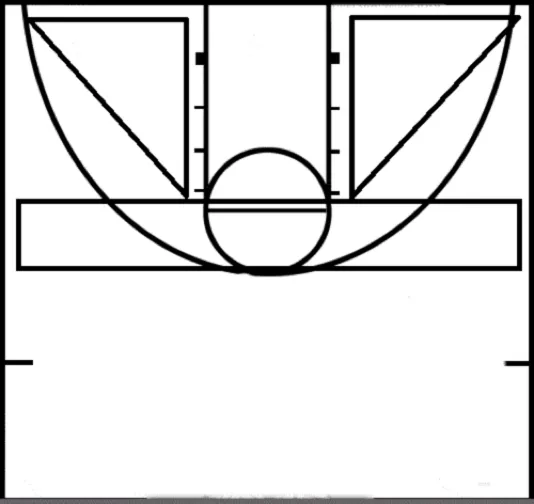
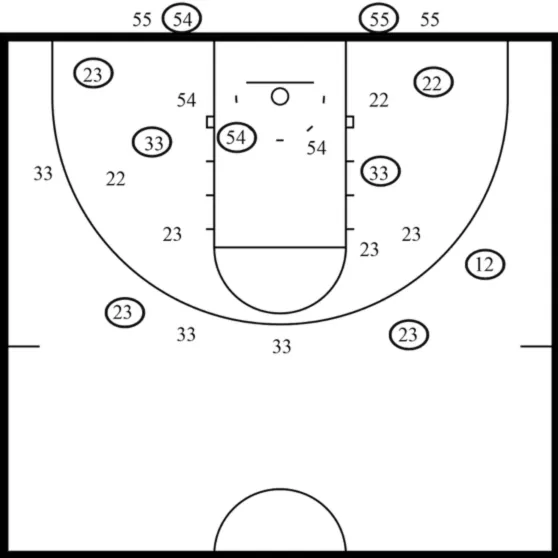
Option #1 - Use Paper and Pencil
On the shot chart, you will see an approximation of the basketball court. Anytime a player takes a shot, write down the number of the player on the spot on the floor where the shot occurs. Then if the shot is made, circle the number. If the shot is missed, leave the number on the page without the circle. For lay-ups, write the numbers on the baseline on the side of the basket they were taken from. Those lay-ups taken from the left side are to the left of the basket. Those taken from the right should be on the right side of the basket. Post shots should be charted from where the shot was taken. Post shots should not be treated like lay-ups.
Option #2 - Use a Tablet and an App to Automate the Process
The other option is to use an app that allows you to chart shots. You pick the point on the chart by tapping your finger and then select the appropriate player.
The benefit to this method is it tracks and calculates everything for you. You can easily create reports based on one game, multiple games, conference games only, or the whole season.
You can also see breakdowns by shot distribution (where are we taking the most shots) and by shooting percentage.
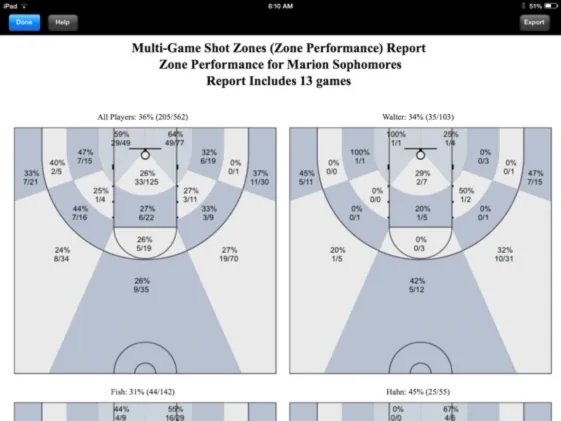
There are certainly advantages to using an app like Breakthrough Stats to chart your shots. But the bottom line is that paper and pencil works too.
Final Thoughts
In summation, a shot chart is very important to the development of your basketball offense. A shot chart allows the coach to show his players their strong areas and weak areas. The coach is allowed to get an idea of how effective his offense is at getting players shots in their area. If the offense is not doing this, it allows the coach to adjust and play to strengths.
In the same vein, the shot chart allows a coach to find his or her opponents' effective areas and take those spots away. The shot chart is a terrific tool for keeping players on the bench involved in and thinking the game out so that when their number is called, they are aware of what is happening on the court and are more prepared.
Related Pages & Helpful Resources
What is Effective Field Goal Percentage?
And Why YOU Should Use It
Shot Chart Download
Shot Chart App
FREE BONUS PDF
5 Checklists For Elite Coaching
Leave your comments, suggestions, and questions below...
|
|||||||


 Facebook (145k Followers)
 YouTube (152k Subscribers)
 Twitter (33k Followers)
 Q&A Forum
 Podcasts