9 Stats That Every Serious Basketball Coach Should Track
I'm a big believer that you should track what is important. As a basketball coach, you can't track everything -- so you pick what you believe are the most important stats and focus on them.
Here's what we believe are the most important basketball statistics for a competitive level coach (high school level and higher) where the primary objective is to win games. (Note: Youth coaches should focus primarily on development and youth appropriate stats like rebounds, assists, high fives, completed passes and so on.)
The First Four Stats (Top Level Stats)
The first four stats give you an instant snapshot of what's happening in the game.
If you beat your opponent in ALL four stats, you will always win. Always.
Basketball is really simple! To win you either need to shoot a higher percentage or take more shots than your opponent. That's all you can do. That's the only way to win a game.
Let's take a look at the stats...
Stat #1 - Field Goal Attempts (FGA)
If you can find a way to consistently take more field goal attempts that your opponent takes (take more shots), then you have a good chance to win games. You can even win if your shooting percentage is lower than your opponent (you know... you're having one of those "off shooting nights").
If you're having an off shooting night, you better have a team that is capable of getting more FG attempts than the opponent!
That's why you need to know if your team is getting more FG attempts or not. It's a critical stat.
Now you don't always have to get more FG attempts than your opponent. For example, if you're shooting 93% and your opponent is only shooting 14%, then you probably won't be getting more FG attempts than your opponent (due to fewer offensive rebounding opportunities).
That's why you should look at your FG attempts and then immediately look at the next stat to put things in perspective...
Stat #2 - Effective Field Goal Percentage (EFG%)
Effective Field Goal percentage gives you an accurate reading on who is shooting better... you or your opponent. EFG% gives more credit to made 3 point field goals since they yield 1.5 times the scoring of a 2 point field goal. The formula is... EFG% = (2Pt + 1.5 x 3Pt) / FGA.
If you can shoot a higher EFG% than your opponent, you have a chance to win the game. We all know shooting is important. So it's certainly something you want to track. I like EFG% because it objectively tells you whether you have the shooting advantage over your opponent or not.
EFG% affects many areas of the game. A good percentage will help you cut down your opponent′s fast break opportunities -- which allows your defense to get set and cut down on personal fouls.
If your EFG% is lower or about the same as your opponent, you better be getting more FG attempts and/or winning in the next two stats...
Stat #3 - Free Throw Attempts (FTA)
This stat will tell you who gets to the free throw line more often. Of course you want to get there more often, for a variety of reasons. For one, getting to the line gives you a "free shot".
Defensively, fouling keeps your team from running in transition, can get key players in foul trouble, and thwarts all your hard work on defensive possessions.
Stat #4 - Free Throw Percentage (FT%)
Free throw percentage is the last piece of the puzzle. We don't put a lot of focus on this stat (although we do shoot a ton of free throws in practice), but this final stat gives you the rest of the story and helps you determine where points are coming from.
Comparing to Your Opponent
By looking at these 4 stats and comparing them to your opponent, you can always tell whether you are winning or losing a game. For me, these are KEY Performance Indicators that all coaches should look for each game. (Note: Be sure to look at the summary report at the end of this article to get a better visual of how you can use these stats. )
Again, if you can beat your opponent in the 4 stats above, you will always win the game. It's impossible for you to lose. And if you beat your opponent in 3 out of the 4 stats above, you'll usually win that game too.
Our Goal
So as a goal, we're always trying to beat our opponent in at least 3 out of those 4 stats. That's our goal every time we play a game.
If you're not looking at those 4 stats above, how can you objectively determine what you should be focusing on as a coach? Maybe you're focusing on the wrong things? Looking at stats helps you figure out what you should be practicing and avoid that mistake.
The Next Five Basketball Stats
Now after looking at the 4 stats above, you can drill down into the next 5 key stats to get a clearer picture of what's happening. The 5 stats below feed directly into the 4 primary stats above.
1) Turnovers - As a coach, you want to know how many turnovers you commit and how it compares to your opponent.
2) Defensive Rebounding Percentage (DReb%) - DReb% is the percentage of available rebounds the defensive team gets. The formula is... DReb% = DReb / (DReb + Opponents OReb).
As we've explained in other articles, you should look at rebounding percentages instead of totals -- because totals do NOT give a true indication of your rebounding performance.
3) Offensive Rebounding Percentage (OReb%) - OReb% is the percentage of available rebounds the offensive team gets. The formula is... OReb% = OReb / (OReb + Opponents DReb).
4) Fouls - Fouls are the enemy of good defense. Nothing is worse than working really hard on a possession only to foul your opponent and gives them two easy free throws.
5) Attempts in the Paint - This is a critical stat that affects offense, defense, and all areas of the game. We want more attempts in the paint than our opponent.
These 5 key stats have a big impact on the game and have an impact on the "4 top level stats" at the beginning of the article.
For example, committing turnovers will lower your FG attempts (a top level stat) and conversely raise your opponent′s FG attempts.
Also, what happens after most turnovers? They turn into easy lay ups for your opponents, which increases their EFG% (another top level stat).
And when the lay ups are missed, you're very rarely in good box-out position. So the opponent gets more rebounds (thus affecting DRB%). In addition, players often commit fouls trying to make up for mistakes and stopping lay ups in transition. And so on.
So as you can see, turnovers alone affect your FG attempts, rebounding, free throws, fouls, defense, and offense.
And if you examine each of the 5 stats above, you'll see they have a big impact on the game and feed directly into the 4 top level stats.
What Do You Look at First?
I always start by looking at the first 4 top level stats because they are directly related to each other and are what I consider "high level indicators".
Then I look at the bottom 5 stats. As an example, I might see that everything is pretty even except our opponent has 10 more FG attempts than us. I want to know why!!
So I look down and might see that our defensive rebounding is terrible and we have 5 more turnovers than the opponent. Now I objectively know what's happening in the game -- and what's helping or hurting us the most.
How to Make it Easier to Collect and Calculate the Stats
That might all sound great and all of us coaches would love to have detailed stats at our finger tips. So how do you easily keep track of all these stats?
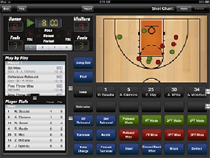
To make it easier to collect and calculate the stats above, you can try our app called Breakthrough Stats. You can download the app in the iTunes store.
The app makes it much easier to collect and calculate all the stats you'll want to improve the performance of your team.
Below you'll see a screen shot of the Key Stats Report. In just a couple taps of the iPad or iPhone, you can instantly calculate all the stats.
This report is the first thing I look at during half time and after the game is over. It gives me a quick and clear story of the game and an objective snapshot of what we need to work on.
You can see the 9 stats above (that we believe are most important) are conveniently grouped into this concise report.
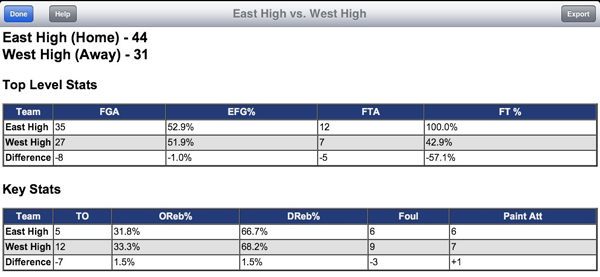
Look at the "Difference" Row
You'll notice the row on the bottom called "difference". I immediately look at the difference to see how our team is doing. If it's a negative number, that means we're not doing good. If it's a positive number, that means we're beating our opponent in that area (and just as importantly I can see exactly how much we're beating them by).
This is a critical report for us and this tool makes me a better coach.
Of course there are other ways to collect and calculate this information. But this app will make it easier.
What do you think? Let us know by leaving your comments, suggestions, and questions...
|
|||||||||||||||||||||||||||


 Facebook (76k Likes)
 YouTube (85k Subscribers)
 Twitter (26k Followers)
 Q&A Forum
 Podcasts